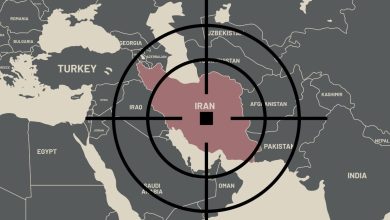
The $30 Billion War What Operation Epic Fury Has Actually Cost America
$28–31bn
Pentagon Cost
$11.3bn
First 6 Days
850+
Tomahawks Fired
44+
Aircraft Lost
$200bn
Emergency Request
12,000+
Combat Sorties
13
US KIA — CENTCOM
381+
US Wounded — CENTCOM
50,000+
US Personnel in Region
Executive Summary
The Iran war cost 2026 is now the defining financial story of Operation Epic Fury. Pentagon budget costs are running between $28 and $31 billion as of April 14 — and that figure covers only direct military expenditure. It does not include the full economic shockwave: oil spiking above $112 a barrel, the Strait of Hormuz choke on global trade, the $200 billion emergency supplemental funding request to Congress, or the multi-year cost of rebuilding stockpiles. This is a full tactical breakdown of where every major dollar has gone — from the first Tomahawk to the last downed Reaper — and what it tells us about the true cost of this war.
🔴 Section One
The Top Line — From $11.3 Billion in Six Days to $30 Billion and Counting
The Iran war cost 2026 was never going to be cheap — but few expected it to accumulate this fast. The first indication of the true scale came when the Pentagon briefed Congress that the first six days of Operation Epic Fury had cost $11.3 billion. CSIS analysts, led by Mark Cancian — a retired U.S. Marine Corps colonel and one of America’s foremost defence budget experts — assessed that even this figure was an undercount. Cancian estimated the actual cost of the first six days at $16 billion once full battle damage assessments, equipment losses and infrastructure repairs were factored in.
Speaking to Harvard Kennedy School on April 6, Cancian put the ongoing daily burn rate at approximately $2 billion in short-term upfront costs. The Irish Times reported a slightly lower CSIS figure of roughly half a billion dollars per day in pure budget terms, excluding replacement and rebuild costs. The Washington Post confirmed that the first two days alone cost $5.6 billion in munitions. The gap between these numbers reflects the ongoing problem: real-time Pentagon reporting systematically excludes infrastructure repair, equipment replacement and the cost of rebuilding depleted stockpiles — all of which are real and growing.
NPR confirmed directly from Cancian that Pentagon budget costs by early April stood at approximately $28 billion when including munitions, forces and losses. The American Enterprise Institute, using a methodology that included deployment costs from late December and five weeks of active operations, placed the figure between $22.3 billion and $31 billion. The $30 billion figure now widely cited is the approximate midpoint of these estimates — and reflects only direct military costs. The administration’s request for $200 billion in emergency supplemental funding from Congress gives the clearest signal of what the full multi-year price tag looks like.
| Cost Category | Estimated Cost | Source / Notes |
|---|---|---|
| Munitions expenditure | $15bn+ | 800+ Patriot interceptors ($3bn+), 850+ Tomahawks, JASSMs, GBU precision-guided bombs, SM-3s, SM-6s |
| Naval operations | $8–10bn | 2 carrier strike groups — USS Gerald R. Ford, USS Abraham Lincoln — plus 14 destroyers and submarines. Ford-class costs ~$6.5m/day |
| Air operations | ~$30m/day | ~200 fighter jets operating continuously — Christian Science Monitor / CSIS |
| Personnel costs | ~$12m/day | Base pay + $10.5m/day in hazard pay and family separation allowances for ~7,000 deployed ground personnel and air/naval crews |
| Combat losses and infrastructure damage | $2.1–3.6bn | AEI estimate — includes USS Gerald R. Ford repair ($13bn carrier requiring 14+ months repair), E-3 AWACS replacement ($700m+), AN/TPY-2 THAAD radars, base repairs |
| SAR mission — F-15 crew recovery, Iran | $200–500m | NPR / Cancian estimate — includes two C-130s destroyed by US forces, helicopter damage, additional air assets |
| Fuel cost surcharge (Pentagon) | $1.3bn+/year | Every $10/barrel increase in oil costs the Pentagon ~$1.3bn/year in operating costs — oil rose $40+/barrel |
| Total Pentagon budget cost (direct military) | $28–31bn | NPR / Cancian (CSIS) — AEI range $22.3bn–$31bn. Does not include full stockpile rebuild or long-term infrastructure repair |
🟡 Section Two
The Aircraft Toll — 44+ Platforms Lost or Damaged in 45 Days
By the standard of recent American air campaigns, the aircraft attrition in Operation Epic Fury is historically high for such a short period. As of April 8, open-source aggregations across CENTCOM statements, US media confirmations and the Wikipedia aviation losses tracker document at least 44 US aircraft lost or damaged — spanning fighter jets, tankers, AWACS, drones and helicopters. The Pentagon has not released a comprehensive official tally. CENTCOM’s only fully confirmed early losses were three F-15Es and one KC-135.
| Platform | Lost | Unit Cost |
|---|---|---|
| F-15E Strike Eagle | 4 | ~$100m |
| F-35A Lightning II | 1 dmg | $82m+ |
| A-10C Thunderbolt II | 1–2 | ~$20m |
| KC-135 Stratotanker | 8 | ~$160m |
| E-3 Sentry AWACS | 1 dest, 1 dmg | $700m+ |
| MQ-9 Reaper | 17 | $32m+ |
| C-130 Hercules | 2 | $75m+ |
| Helicopters (UH-60/HH-60/CH-47) | 5+ | $6–40m |
| USS Gerald R. Ford | Major dmg | $13bn — 14mo repair |
🔵 Section Three
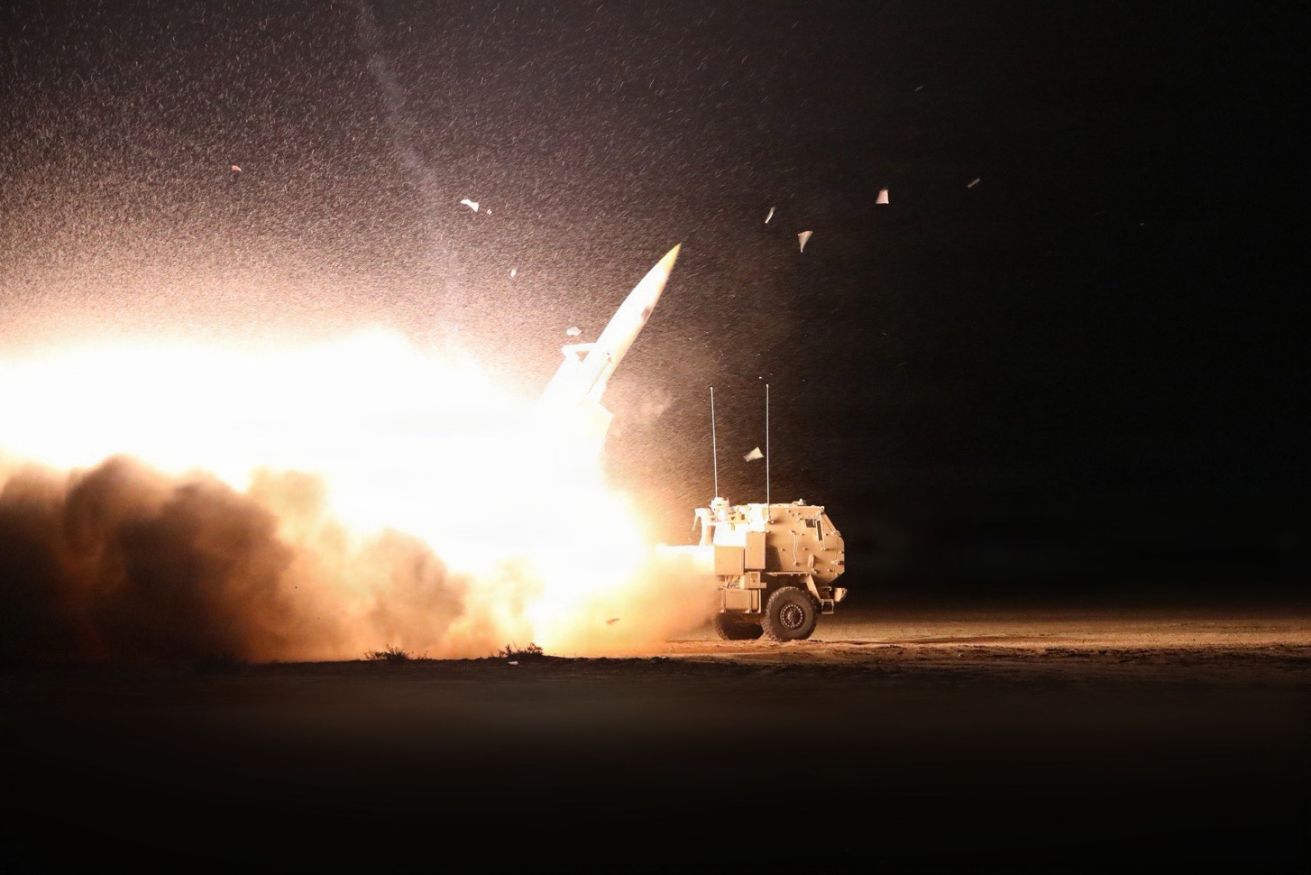
The Munitions Crisis — Burning Through Stockpiles at an Unprecedented Rate
The Iran war cost 2026 cannot be understood without understanding the munitions burn rate — because what is being consumed now will take years and hundreds of billions to replace. Cancian told Harvard Kennedy School that the U.S. “fired more Patriot missiles in the first four days of this war than we have produced in the last two to three years.” More than 800 Patriot interceptors have been fired at a unit cost of approximately $4 million each — putting that single line item above $3 billion. Chief of Naval Operations Admiral Daryl Caudle confirmed at a CSIS event: “We’ve shot a lot of munitions. The munitions have taken a hit.”
More than 850 Tomahawk cruise missiles have been fired by surface ships and submarines — each costing approximately $2 million, representing over $1.7 billion in that category alone. Joint Air-to-Surface Standoff Missiles (JASSMs) are assessed by CSIS to be the primary air-launched, long-range munition used in the campaign. SM-3 and SM-6 interceptors are being consumed at a rate that FY 2026 production cannot cover, creating a growing inventory gap that will take years to close.
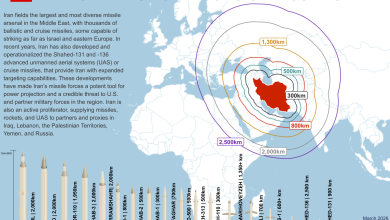
The asymmetry is the most alarming element. Iran has been producing roughly 10,000 Shahed drones per month at an estimated $30,000 each. The U.S. has been shooting them down with interceptors costing $4 million apiece — a cost ratio of approximately 130:1 in Iran’s favour on that exchange alone. The U.S. LUCAS drone — a low-cost one-way attack system introduced for the first time in this conflict — is one answer to that problem, but it is not yet deployed at the scale needed to shift the arithmetic.
The Drone Cost Asymmetry — Iran’s Cheapest Weapon vs America’s Most Expensive Defence
Iran’s Shahed-136
Cost per unit: ~$30,000
Production rate: ~10,000/month
Monthly production cost: ~$300 million
US Patriot Interceptor (PAC-3)
Cost per unit: ~$4,000,000
Production rate: ~600/year (expanding to 2,000)
Cost ratio vs Shahed: 133:1
The U.S. has signed multi-year contracts with Lockheed Martin to increase Patriot production from 600 to 2,000 per year, with THAAD interceptors to expand from 96 to 400 per year. RTX has committed to surging Tomahawk production above 1,000 annually. These are large-scale industrial expansions that will take years to materialise and cost hundreds of billions — none of which is captured in the $28–31 billion operational figure.
🟡 Section Four
Iran vs Iraq — How Operation Epic Fury Compares to Every Previous U.S. Missile Campaign
Operation Epic Fury has already surpassed every previous U.S. conflict in Tomahawk expenditure — including the 2003 invasion of Iraq, which was previously the single most missile-intensive campaign in American military history. The Iran war has done this in 45 days. Iraq 2003 took the entire duration of major combat operations to reach its total. The scale of the comparison is stark, and it reflects one fundamental reality: Iran is a far more complex military target than Saddam Hussein’s Iraq ever was.
| Operation | Year | Missiles | Days |
|---|---|---|---|
| Desert Storm | 1991 | 288 | 43 |
| Desert Fox | 1998 | 325 | 4 |
| Yugoslavia | 1999 | 218 | 78 |
| Afghanistan | 2001 | ~70 | — |
| Iraq 2003 prev. record | 2003 | 802+ | 26 |
| Libya | 2011 | 161 | 3 |
| Syria | 2017 | 59 | 1 |
| Yemen | 2024 | 80+ | 1 |
| Iran pre-war | 2025 | 30 | 1 |
| ⚡ Epic Fury — Iran NEW RECORD |
2026 | 850+ | 45+ |
The scale differential is not just numerical — it is structural. When the U.S. fired 802 Tomahawks in Iraq in 2003, those 802 missiles represented approximately one-third of the entire U.S. Tomahawk inventory at the time. The 850+ fired at Iran in 45 days have been launched from a larger fleet, but they have still consumed a significant portion of available stocks — and unlike Iraq, Iran has not been defeated in those 45 days. The ceasefire is fragile, the Strait of Hormuz remains contested, and the Islamabad talks collapsed without a deal. Every day the ceasefire holds without a permanent agreement is a day the stockpile deficit deepens. Every day it breaks is a day the Tomahawk burn rate resumes.
Bellingcat’s open-source analysis geolocated Tomahawk missiles transiting Iraqi Kurdistan en route to Iran — identifying at least 20 individual missiles in a single sequence alongside the Zagros Mountain range, approximately 50km southeast of Kirkuk. The missiles followed the same low-altitude, terrain-hugging flight profile that has characterised every Tomahawk campaign since 1991 — but the scale, frequency and geographic complexity of routing them over multiple sovereign airspaces simultaneously was unprecedented.
🟢 Section Five
The Hidden Costs — What the $30 Billion Figure Does Not Include
The $28–31 billion Pentagon figure is already alarming. But it systematically excludes several categories of cost that are just as real. The first is the economic shockwave. Brent crude surged from approximately $72 to over $112 a barrel — a 55% rise — driven by the Strait of Hormuz closure. U.S. average gas prices rose 20–30 cents per gallon, adding an estimated $4–6 billion in higher fuel costs for American families and businesses. United Airlines alone faced approximately $11 billion in additional annual fuel costs. The IEA described the situation as the “greatest global energy security challenge in history.”
The Suez Canal — a secondary casualty of the conflict disrupting global shipping — has lost approximately $10 billion in activity according to the World Bank. Global supply chains for materials including tungsten (up 50%+ since March 2026) and sulfuric acid (up 30%) have been severely disrupted. Iran is now expected to see its economy shrink by 10% — which will further destabilise the region and create long-term consequences that have no entry in the current cost ledger.
The strategic costs are potentially the most significant of all. CSIS missile defence expert Tom Karako warned directly that the damaged and destroyed AN/TPY-2 THAAD radar — described as irreplaceable on short notice — represents a gap in the U.S. defensive architecture that extends far beyond Iran. “You cannot take an Amazon Basics radar and substitute it for an AN/TPY-2,” he said. The U.S. has reportedly begun moving elements of its missile defence architecture from South Korea to the Middle East to compensate — creating a gap in Pacific defences that has not gone unnoticed in Beijing. Karako told the Irish Times he worried that continued attrition in the Middle East could tempt China to consider a military campaign to claim Taiwan. “We cannot afford to keep expending these things.”
Defence Secretary Pete Hegseth has acknowledged the pattern of Iranian targeting: “There are some things adversaries are doing to provide info and intel they shouldn’t. We’re aware of it.” He said commanders were working to adjust in real time and ensure assets were not in predictable patterns. A former senior U.S. military official was more direct in his assessment of the damage to date, describing much of it as “self-inflicted” — the result of inadequate base hardening, predictable positioning of high-value assets, and coordination failures that allowed Iranian targeting to be effective.
🔴 Section Five
The Human Cost — U.S. Personnel Killed and Wounded in Action
As of April 8, 2026 — Day 40 of Operation Epic Fury — U.S. Central Command confirmed 13 American service members killed and 381 wounded in action. Joint Chiefs Chairman General Dan Caine honoured the fallen directly at the CENTCOM briefing: “I ask that we never forget our fallen and their families — especially the 13 fallen from Operation Epic Fury. May we always be worthy of their sacrifice and honor their legacy.” The U.S. military has more than 50,000 personnel currently deployed in the region.
The first American deaths came within hours of the opening strikes on February 28. By March 1, CENTCOM confirmed three service members killed and five seriously wounded. One of those seriously wounded later died, bringing the count to four by March 2. The single deadliest incident for American forces came at Port Shuaiba in Kuwait, where six personnel were killed in a drone strike. A further soldier died from an enemy attack at Prince Sultan Air Base in Saudi Arabia on March 1. The Pentagon added the Iran war to its Defense Casualty Analysis System — the database that catalogues U.S. combat casualties dating back to World War I — as the death toll mounted.
The wounded count rose steadily throughout the campaign. By March 24 it stood at 290, with 255 of those having returned to duty and 10 remaining seriously wounded. By March 31 it had reached 348, with 315 returned to duty and 6 seriously wounded. The final confirmed CENTCOM figure of 381 as of April 8 reflects those in the official casualty tracking system — but investigative reporting by The Intercept found the real number is likely higher. CENTCOM’s figures exclude more than 200 sailors treated for smoke inhalation and lacerations from the USS Gerald R. Ford laundry fire on March 12, as well as other non-combat injuries sustained during operational deployments. With those figures included, estimates of total personnel affected by injury or illness during the campaign exceed 520.
U.S. Personnel Casualties — Operation Epic Fury (Feb 28 – Apr 8, 2026)
- Killed in action (official CENTCOM/DCAS): 13 — including 6 killed in drone strike at Port Shuaiba, Kuwait; 1 killed at Prince Sultan Air Base, Saudi Arabia, March 1; KC-135 mid-air collision killed 6 crew over western Iraq, March 12
- Wounded in action (official CENTCOM): 381 as of April 8 — approximately 91% returned to duty; 6 remained seriously wounded
- Additional non-combat injuries (excluded from official count): 200+ sailors treated for smoke inhalation/lacerations — USS Gerald R. Ford fire, March 12. Additional personnel injured in operational accidents not tracked by DCAS
- Estimated total affected (including non-combat): 520+ — per The Intercept’s analysis of CENTCOM and DCAS data
- Medical evacuation: ~25 treated at Landstuhl Regional Medical Center, Germany; ~12 evacuated to Walter Reed National Military Medical Center, Maryland; 1 transported to Brooke Army Medical Center (DoD’s only Level I trauma centre) — mid-March figures
- Total US personnel in region: 50,000+ — CENTCOM confirmed
The discrepancy between official figures and real numbers reflects a persistent issue with CENTCOM’s casualty reporting throughout the campaign. The Intercept documented more than a dozen unanswered requests to CENTCOM for casualty clarification, with the command repeatedly providing figures that were days old and excluded confirmed incidents. One defence official described the pattern to The Intercept as a “casualty cover-up.” The Pentagon did not reply to requests for comment on the discrepancy. What is certain is that the 13 confirmed American dead represent the highest U.S. combat death toll in a single conflict since the Afghanistan war — and the campaign is not over.
🔴 Section Seven
The Strategic Picture — What This Cost Means for the Next Fight
Penn Wharton’s modelling of the Iran war cost places the total direct military figure at $40–95 billion and the total economic impact at up to $210 billion. That range reflects genuine uncertainty — but the methodology behind it is sound. Wars always cost more than initial estimates. George W. Bush’s chief economic advisor Larry Lindsey was fired for predicting the Iraq war might cost $200 billion. It cost $5 trillion. Russia thought it could take Ukraine in weeks. The pattern repeats.
The Iran war cost 2026 will not ultimately be measured only in dollars spent. It will be measured in stockpiles depleted, in production contracts signed that will consume defence budgets for years, in strategic assets diverted from the Pacific, and in the diplomatic isolation that has accompanied the campaign. Six in ten Americans disapprove of Trump’s handling of the conflict according to a Pew survey. The Islamabad talks collapsed without a deal. The ceasefire has 10 days left. The $30 billion figure may look modest against where this ends.
Strategy Battles Assessment
The $30 billion number is not the story. The story is what it doesn’t include and what it reveals. The Patriot burn rate alone has exposed a fundamental weakness in American air defence economics — a $4 million interceptor killing a $30,000 drone is a ratio that Iran can sustain indefinitely and the U.S. cannot. The E-3 loss is a capability gap that cannot be quickly filled. The AN/TPY-2 damage is a Pacific vulnerability dressed up as a Middle East incident. And the USS Gerald R. Ford’s 14-month repair timeline is a carrier strike group taken off the board for over a year.
This is the most expensive 45-day air campaign in American history by any per-day metric. The administration entered it believing it would be short and decisive. The $200 billion emergency supplemental request tells you everything you need to know about how that calculation turned out.
Strategy Battles — Related Coverage
Sources
- CSIS — Iran War Cost Estimate Update: $11.3 Billion at Day 6, $16.5 Billion at Day 12 (March 13, 2026)
- Harvard Kennedy School — Why Is the War in Iran So Expensive? (April 6, 2026)
- NPR — How Much Has the U.S. Spent on the War in Iran? (April 7, 2026)
- Irish Times — Hundreds of Millions of Dollars a Day: US Counts Cost of War on Iran (April 7, 2026)
- Axios — Iran War Costs Grow as Key U.S. Systems Are Knocked Out (April 1, 2026)
- Christian Science Monitor — War Shakes the Middle East and the US Budget (March 18, 2026)
- Airforce Technology — How Many Aircraft Has the US Lost in the Iran War? (April 2026)
- Wikipedia — List of Aviation Shootdowns and Accidents During the 2026 Iran War
- Wikipedia — Economic Impact of the 2026 Iran War
- Middle East Monitor — Factbox: Iran War US Military Aircraft Damage and Losses (April 7, 2026)
- The National — A $30bn Bill: The Cost of America’s War on Iran (April 14, 2026)
Editorial Verification
This report has been reviewed for tactical and financial accuracy. All cost figures are cross-referenced across a minimum of two independent verified sources. The $28–31bn Pentagon budget cost figure is sourced to both NPR/Cancian (CSIS) and the AEI’s Elaine McCusker range estimate. Aircraft losses are drawn from CENTCOM-confirmed reports and open-source aggregations by Wikipedia’s aviation losses tracker, Airforce Technology, and The Defense News. Where figures are disputed or estimates, this is clearly indicated. This is original editorial analysis by Strategy Battles and does not reproduce any single source.
Approved for Publication
Marcus V. Thorne
Lead Editor, Strategy Battles
©StrategyBattles.net 2026
This article is for news and analysis purposes only. It is based on publicly available news sources and military updates. All rights reserved. Original reporting may come from various open sources. Not for commercial reuse without permission.